Upper-Ocean Processes under the Stratus Cloud Deck in the Southeast Pacific Ocean.

Yangxing Zheng, George N Kiladis, Toshiaki Shinoda, E Joseph Metzger, Harley E Hurlburt, Jialin Lin, and Benjamin S Giese.

Abstract The annual mean heat budget of the upper ocean beneath the stratocumulus/stratus cloud deck in the southeast Pacific is estimated using Simple Ocean Data Assimilation (SODA) and an eddy-resolving Hybrid Coordinate Ocean Model (HYCOM). Both are compared with estimates based on Woods Hole Oceanographic Institution (WHOI) Improved Meteorological (IMET) buoy observations at 20°S, 85°W. Net surface heat fluxes are positive (warming) over most of the area under the stratus cloud deck. Upper-ocean processes responsible for balancing the surface heat flux are examined by estimating each term in the heat equation. In contrast to surface heat fluxes, geostrophic transport in the upper 50 m causes net cooling in most of the stratus cloud deck region. Ekman transport provides net warming north of the IMET site and net cooling south of the IMET site. Although the eddy heat flux divergence term can be comparable to other terms at a particular location, such as the IMET mooring site, it is negligible for the entire stratus region when area averaged because it is not spatially coherent in the open ocean. Although cold-core eddies are often generated near the coast in the eddy-resolving model, they do not significantly impact the heat budget in the open ocean in the southeast Pacific.

http://dx.doi.org/10.1175/2009JPO4213.1

http://journals.ametsoc.org/doi/full/10.1175/2009JPO4213.1

Abstract

  • Net surface heat fluxes are positive (warming) over most of the area under the stratus cloud deck.
  • Upper ocean processes balance this net warming from the surface fluxes.
  • Geostrophic transport in the top 50 m causes net cooling in most of the surface under the stratus deck.
  • Ekman transport causes net warming north of the IMET buoy site and net cooling south of the buoy site.
  • Eddy heat flux divergence is not coherent over the open ocean.

Introduction

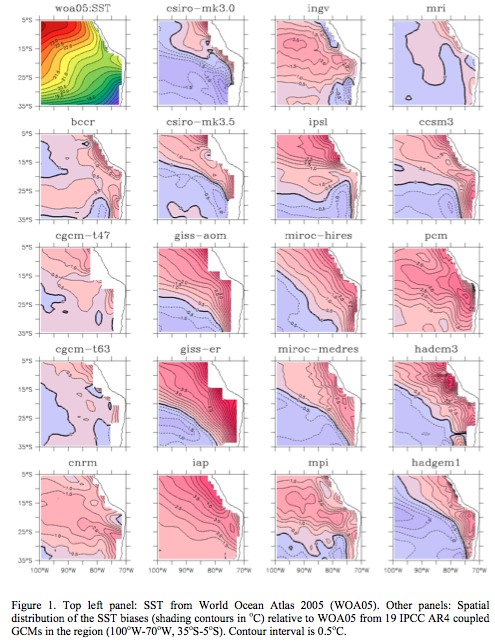
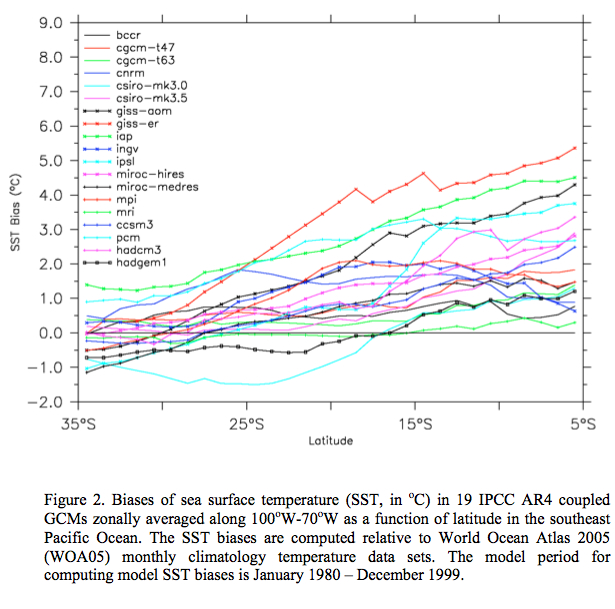
  • SSTs in the Southeast Pacific near the coast of Peru and Chile are colder than at any other comparable latitude around the globe.
  • These cold SSTs are believed to play an important role in the formation and maintenance of the persistent stratus deck in this region.
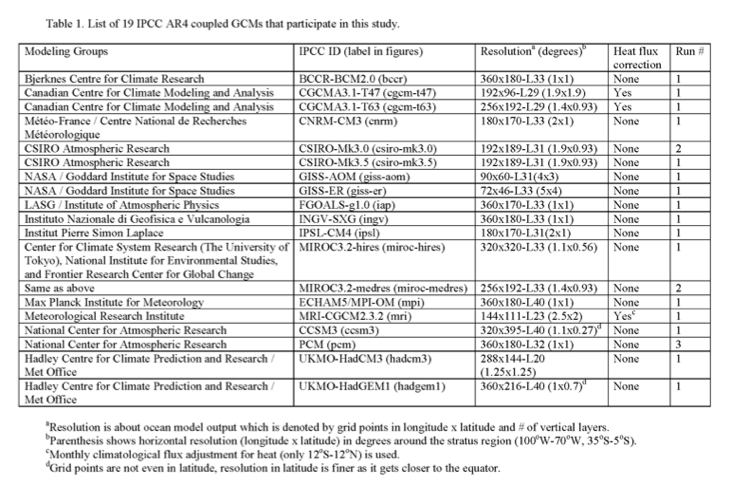
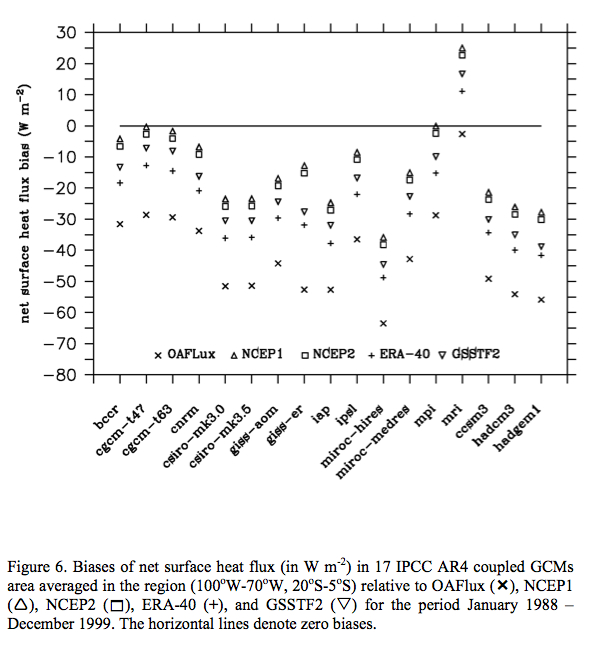
  • Most coupled global ocean GCM models have a systematic warm SST bias and low cloud cover in this region.
  • Colbo and Weller (2007) estimate the upper budget from 6 year time series of temperature, salinity, velocity and surface meteorological variables.
  • They conclude that in the top 250 m, the surface warming (positive surface heat fluxes) is balanced by geostrophic heat transport and eddy heat flux divergence.
  • They deduce from these analysis that cold core eddies from the coast propagate westward transporting heat offshore and cooling the SST.
  • The main drawback of their calculation is that the eddy heat flux divergence in the heat equation is calculated as a residual of all other terms.
  • Also, 250 m depth advection and eddy heat flux divergence may not affect the surface SSTs as the winter time mixed layer in most of this region is only 150 m.
  • This study uses the SODA dataset and the HYCOM global ocean model for the ocean state variables.
  • The data from the mooring site are used to validate the model.

Model and Datasets

  • SODA dataset is used. Its based on the LANL POP model simulations with a resolution of 0.4 deg x 0.25 deg (longitude x latitude) with 40 vertical levels. Time period of data available – 1958-2001 forced by ECMWF and 2002 to 2005 forced by QuikSCAT winds.
  • Surface fluxes are computed from bulk formulae.
  • HYCOM model is used for the analysis.
  • Observation data set used in this study is from the WHOI IMET buoy deployed at 20S 85W in Oct 2000.
  • Surface heat fluxes are calculated from SST and surface met. data from the buoy using the TOGA-COARE bulk air-sea flux algorithm. (Bradley,2000).
  • AVISO SSH is used to validate the model’s ability to simulate eddy activity.

wpid-j-phys_-oceanogr-2010zheng-pdfpage4of18-2011-08-17-10-342.jpg

Comparisons with IMET obs.

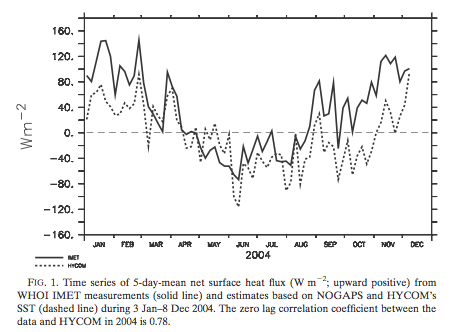
  • The seasonal cycle in the surface heat fluxes of the model tracks that from the IMET buoy.
  • Yet, during Jan-Feb and Sep-Oct-Nov, there is a difference of 80 Wm-2
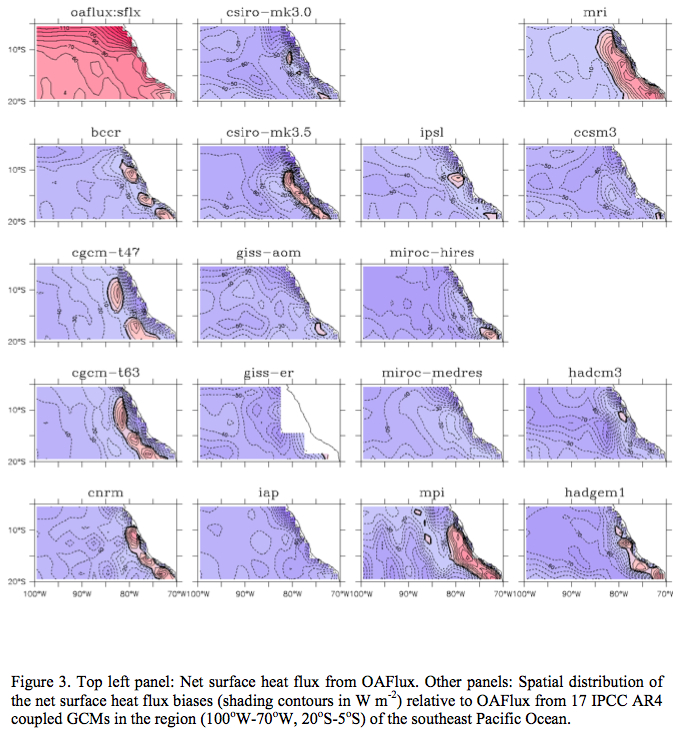
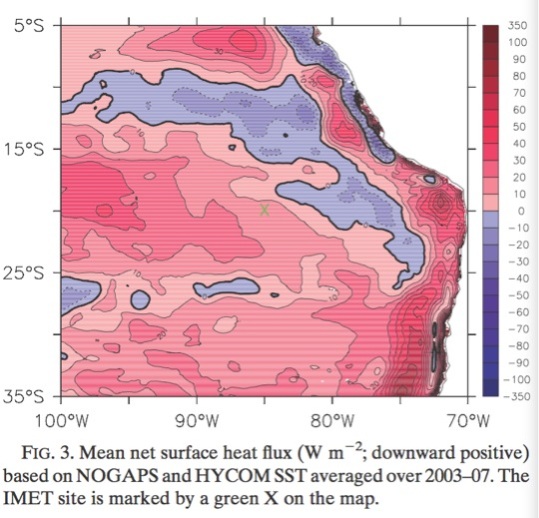
  • Spatial distribution of NOGAPS sfc fluxes are positive in most areas discussed which is consistent with IMET estimates.
  • wpid-j-phys_-oceanogr-2010zheng-pdfpage5of18-2011-08-17-10-342.jpg
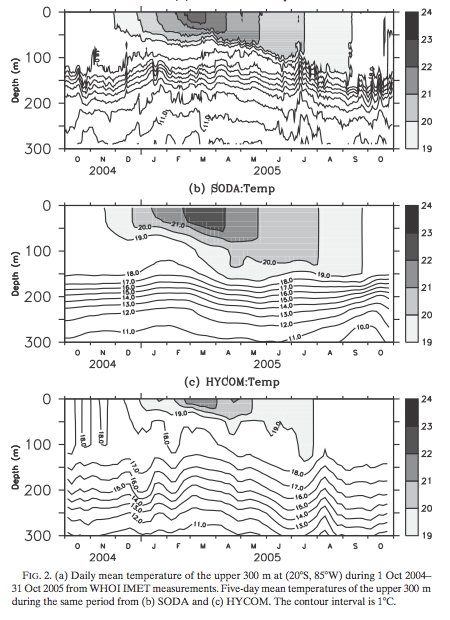
  • SODA and HYCOM have smoother fields compared to insitu IMET measurements.
  • Yet both of them are able capture the seasonal cycle of the mixed layer.
  • The mixed layer depth is 20-30 m in the austral summer (Feb-Mar) and becomes deepest (~150m) after the austral winter (Sept-Oct)

Mean Heat Budget

wpid-j-phys_-oceanogr-2010zheng-pdfpage6of18-2011-08-17-10-342.jpg

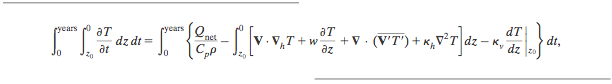
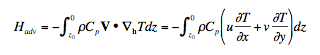
  • Qnet is the net sfc heat flux, Cp is the specific heat of seawater at constant pressure, rho is the density of seawater, w is the vertical velocity, V is horizontal velocity vector, T is temperature and V’ and T’ are deviations from the seasonal mean.
  • The divergence of the eddy heat flux is given by the V’T’ term in the above equation.
  • The seasonal average of V and T are used as the mean values in this study.

wpid-j-phys_-oceanogr-2010zheng-pdfpage5of18-1-2011-08-17-10-342.jpg

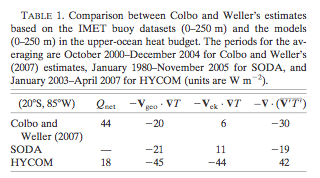
  • Table 1 shows that the dominant terms in the heat balance in the IMET buoy observations are Qnet (+), geostrophic transport(-) and Ekman transport(-).
  • For the HYCOM model, the Ekman transport(-), geostrophic transport(-) are balanced by the eddy flux divergence(+). The Qnet(+) is of a smaller magnitude.
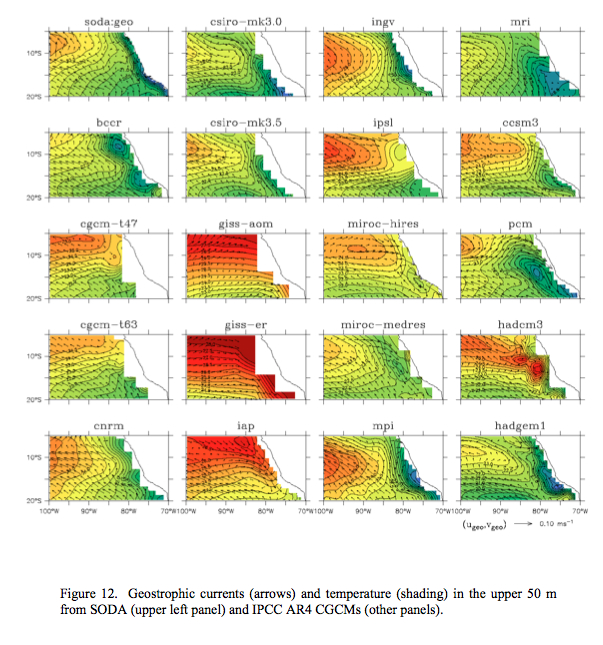
  • Geostrophic currents are computed from the model temperature and salinity.
  • Ekman currents are the difference between the total velocity and the geostrophic velocity.
  • Eddy flux divergence is large in the IMET observations and in the models. In HYCOM, it has a positive sign unlike in SODA and IMET.
  • Area average values are derived for the model outputs to compare with IMET estimates in the region 30-10S, 100-80 W.
  • wpid-j-phys_-oceanogr-2010zheng-pdfpage7of18-2011-08-17-10-342.jpg
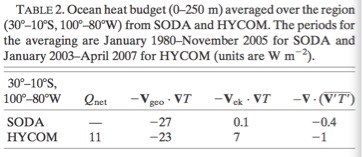
  • Also values for just the upper 50 m were derived as in shallow mixed layer conditions eddy flux divergence and horizontal heat advection at 250 m might not impact the SST.

Spatial distribution of the upper ocean heat budget

  • Net surface heat flux is positive over most of the region under the stratus deck.
  • Strong warming from the net sfc heat flux neat the coast south of 15S.

wpid-j-phys_-oceanogr-2010zheng-pdfpage7of18-1-2011-08-17-10-342.jpg

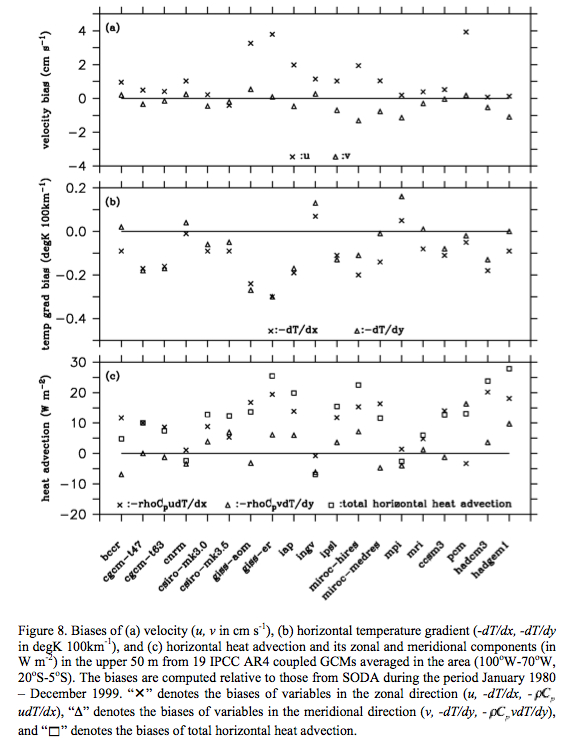
  • Geostrophic advection of heat causes significant upper-ocean cooling over the stratus cloud deck region.
  • Northwestward geostrophic currents in most of the stratus deck region cross the isotherms nearly perpendicularly and thus geostrophic currents transport cold water to the stratus cloud region.

wpid-j-phys_-oceanogr-2010zheng-pdfpage8of18-2011-08-17-10-342.jpg

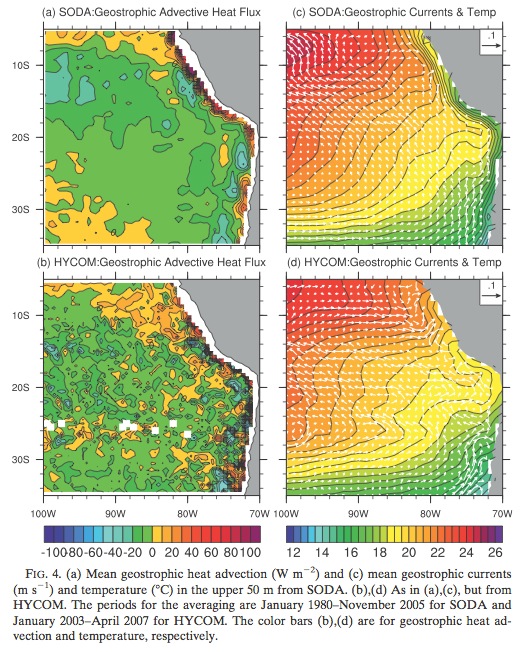
  • In some locations (south of 30S between 100 and 90 W , geostrophic currents are parallel to the isotherms) heat advection by geostrophic currents is negligible compared to the Ekman transport.
  • Yet in most of the locations, from the model analysis and IMET buoy studies, the heat advection due to geostrophic currents is significant.

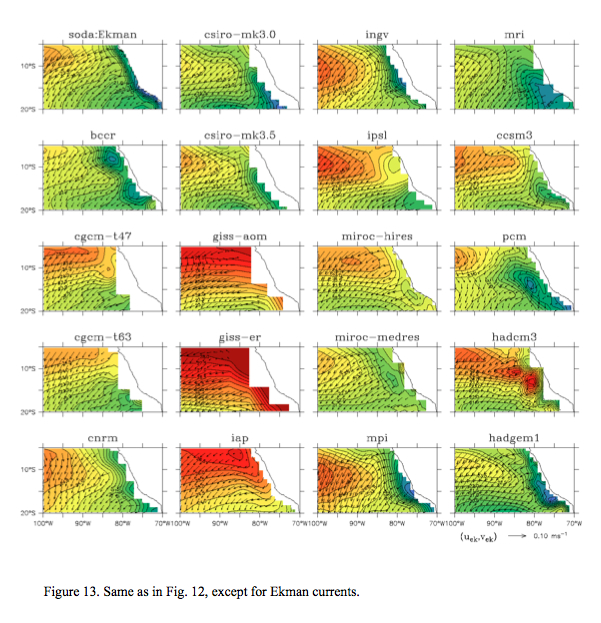
Ekman transport of heat

  • In SODA, Ekman heat transport causes warming north of the IMET site.

wpid-j-phys_-oceanogr-2010zheng-pdfpage9of18-2011-08-17-10-342.jpg

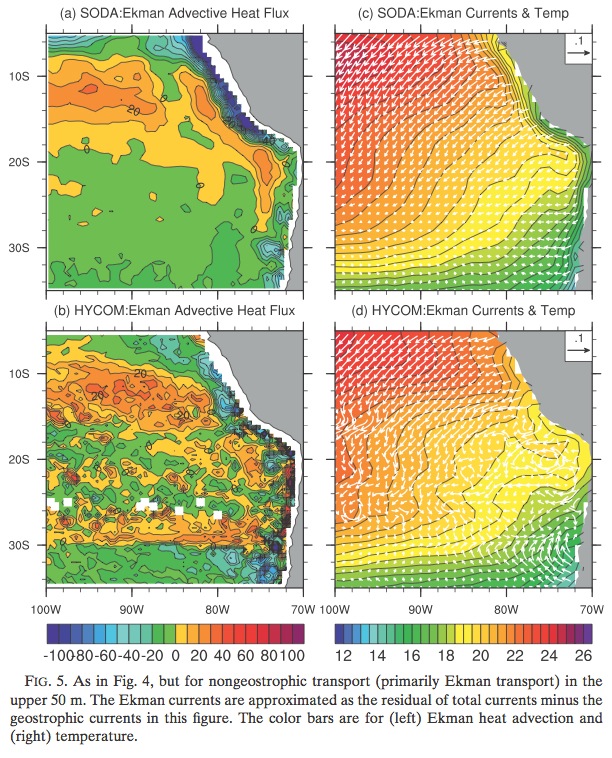
  • Ekman heat transport at the IMET site is negligible as it is at the boundary of the positive and negative heat advection.
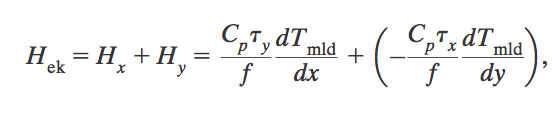
  • Ekman mass transport is given by:

wpid-j-phys_-oceanogr-2010zheng-pdfpage9of18-1-2011-08-17-10-342.jpg

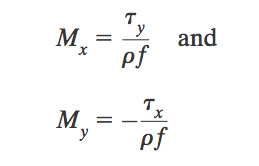
  • Ekman advective heat flux is given by :

wpid-j-phys_-oceanogr-2010zheng-pdfpage10of18-2011-08-17-10-342.jpg

Mean advective heat flux in the mixed layer resulting from Ekman transport, mixed layer temperature and Ekman transport can be seen in the figure below.

wpid-j-phys_-oceanogr-2010zheng-pdfpage10of18-1-2011-08-17-10-342.jpg

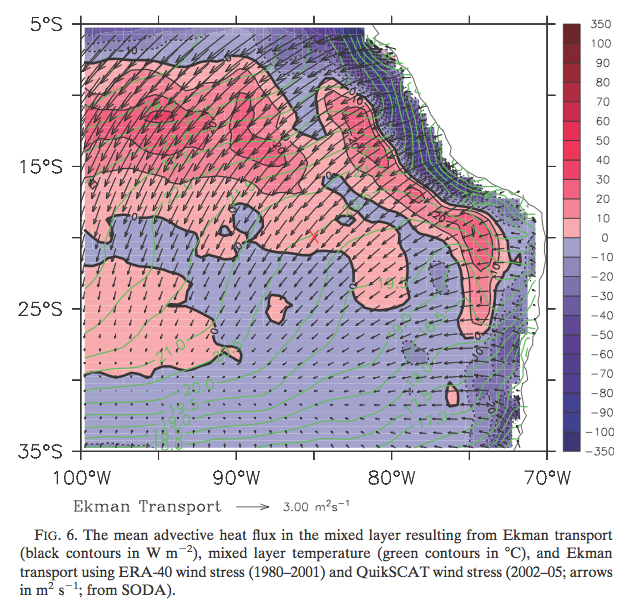
  • Ekman heat transport is positive north of the IMET site and negative south of this site.
  • Ekman transport is nearly parallel to the mean SST isotherms in the offshore region near the IMET site.

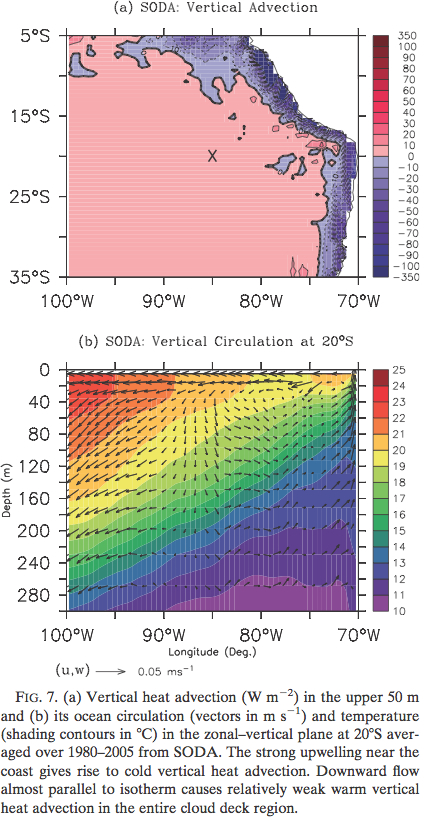
Vertical Heat advection

  • Vertical advection causes weak warming in the open ocean but not in the coastal region where strong upwelling occurs.
  • The cooling resulting from the upwelling near the coast is balanced by the positive net sfc heat flux.
  • Cold water upwelled near the coast is advected offshore by the mean flow in the upper 40m.
  • Because of convergence of sfc currents in the open ocean, weak subsurface warming occurs due to vertical heat advection in most of the areas under the stratus region.

wpid-j-phys_-oceanogr-2010zheng-pdfpage11of18-2011-08-17-10-342.jpg

Eddy Heat flux divergence
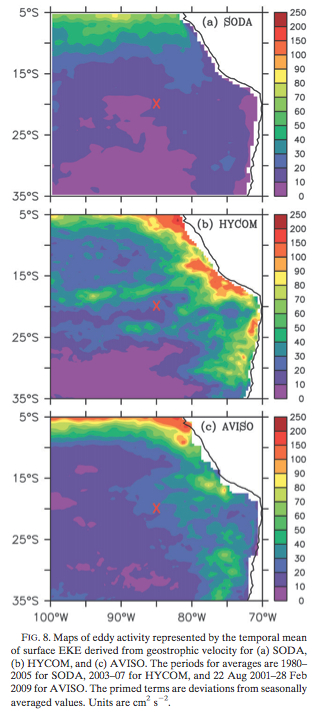
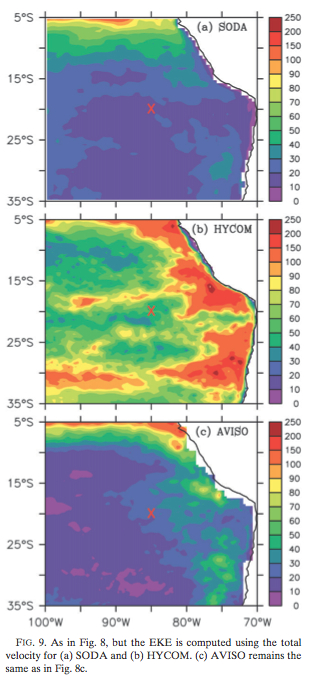
  • Eddy Kinetic energy
    • Eddies are more active near the coastal region than in the open ocean.
    • HYCOM EKE is higher than in AVISO derived EKE.
    • Peru-Humboldt current can interact with the coastline and cause higher eddy activity close to the coast.
    • Also strong upwelling fronts in spring and summer can cause strong baroclinic instabilities than can enhance mesoscale variability.
    • Downwelling coastal Kelvin waves can strongly intensify the Peru-Chile Undercurrent system which may destabilize the near-sfc coastal circulation generating eddies (Shaffer et al., 1997).
    • wpid-j-phys_-oceanogr-2010zheng-pdfpage12of18-2011-08-17-10-342.jpgwpid-j-phys_-oceanogr-2010zheng-pdfpage12of18-1-2011-08-17-10-342.jpg
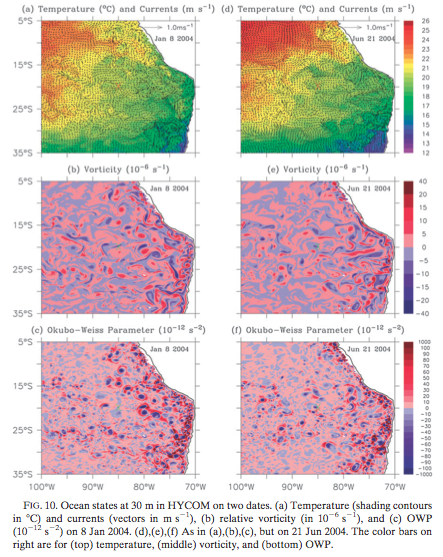
    • Vertical component of the vorticity and the Okubo-Weiss parameter (OWP) at 30 m depth were computed.

wpid-j-phys_-oceanogr-2010zheng-pdfpage13of18-2011-08-17-10-342.jpg

  • OWP is defined as:

wpid-j-phys_-oceanogr-2010zheng-pdfpage13of18-1-2011-08-17-10-342.jpg

  • Eddies can be defined as patched of negative OWP values surrounded by positive rings.
  • Eddies are seen to be more active near the coast and weaker in the open ocean.

Example of cold-core eddies

  • wpid-j-phys_-oceanogr-2010zheng-pdfpage14of18-2011-08-17-10-342.jpg
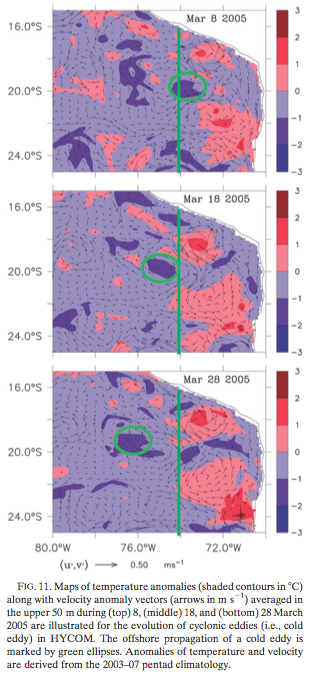
  • Anticyclonic eddies are warm core and cyclonic eddies are cold core eddies.

wpid-j-phys_-oceanogr-2010zheng-pdfpage14of18-1-2011-08-17-10-342.jpg

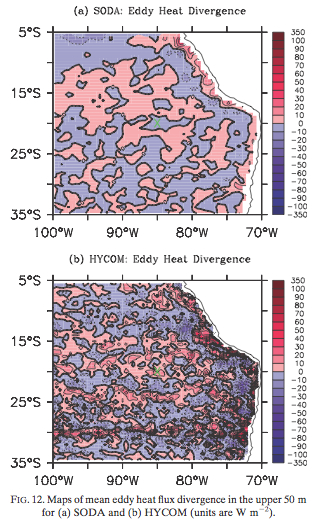
  • Mean eddy heat flux divergence in upper 50 m is seen in fig 12.
  • Mean eddy heat flux divergence in time is noted to be negligible as it is not spatially coherent.
  • Subsurface cold waters trapped in the eddies are more visible offshore than cold water at the surface due to warming at the surface from sfc heat flux.

Discussion

  • Heat advection dues to Ekman transport is significant to the North of 20 deg S. It gives stronger warming to the North of 20S.
  • Eddy heat flux divergence term is negligible both North and South of 20S.
  • Vertical diffusion is a term neglected in this study due to the difficulty in estimating it in models.
  • HYCOM model output shows eddy heat flux divergence is negligible compared to the horizontal heat advection.

Summary

  • Net warming of the surface is due to the surface heat flux.
  • This is balanced by the cooling due to horizontal geostrophic transport.
  • Ekman transport is comparable to the geostrophic currents, but the heat transport due to geostrophic currents is significant as these currents are perpendicular to the isotherms.
  • Ekman currents are parallel to the isotherms of SST.
  • Ekman transport generates warming north of 20S and cooling south of there.

Zheng, Y. et al., Upper-Ocean Processes under the Stratus Cloud Deck in the Southeast Pacific Ocean.

Sea Surface Temperature Biases under the Stratus Cloud Deck in the Southeast Pacific Ocean in 19 IPCC AR4 Coupled General Circulation Models.

Yangxing Zheng, Toshiaki Shinoda, Jia-Lin Lin, George N Kiladis.

This study examines systematic biases in sea surface temperature (SST) under the stratus cloud deck in the southeast Pacific and upper ocean processes relevant to the SST biases in 19 coupled general circulation models (CGCMs) participating in the Intergovernmental Panel on Climate Change (IPCC) Fourth Assessment Report (AR4). The twenty years of simulations from each model are analyzed. Pronounced warm SST biases in a large portion of the southeast Pacific stratus region are found in all models. Processes that could contribute to the SST biases are examined in detail based on the computation of major terms in the upper ocean heat budget. Negative biases in net surface heat fluxes are evident in most of the models, suggesting that the cause of the warm SST biases in models is not explained by errors in net surface heat fluxes. Biases in heat transport by Ekman currents largely contribute to the warm SST biases both near the coast and the open ocean. In the coastal area, southwestward Ekman currents and upwelling in most models are much weaker than observed due to weaker alongshore winds, resulting in insufficient advection of cold water from the coast. In the open ocean, warm advection due to Ekman currents is overestimated in models because of the larger meridional temperature gradient, the smaller zonal temperature gradient and overly weaker Ekman currents. – Journal of Climate (2011)

http://journals.ametsoc.org/doi/abs/10.1175/2011JCLI4172.1

————————————————————————————————————————————

Abstract

  • Warm SST bias is found in all models in the Southeast Pacific region.
  • Upper ocean heat budget is examined in detail.
  • Negative biases in net surface heat fluxes.
  • Biases in heat transport due to Ekman currents is largely the reason for the warm SST biases in the models.
  • Most models have a weaker upwelling due to weaker alongshore winds.
  • Hence, the heat transport offshore is weaker in the models.
  • In the open ocean, warm advection due to Ekman currents is overestimated because of larger meridional temp. gradients, smaller zonal temp. gradients and overly weaker Ekman currents.

Introduction

  • Coastal upwelling due to alongshore winds brings cold water to the surface, stabilizing the lower troposphere and hence supporting the maintenance of the persistent stratus/stratocumulus cloud decks.

Models and Validation datasets

  • 19 IPCC coupled models are used for this study. Monthly means of model variables are used for the diagnosis for the period 1980 – 1999.

wpid-jclimate2011zheng-pdfpage39of64-2011-03-5-18-57.jpg

SODA – Model output roughly on 0.4(lon) x 0.25(lat) deg resolution with 40 vertical levels

  • ERA-40 sfc wind forcing used.
  • Sfc heat flux forcing calculated using the bulk formulation and NCEP met variables.
  • KPP mixing scheme for the vertical and biharmonic horizontal mixing scheme used.

Heat Flux Datasets

  • OAFlux is used

SST biases

  • SST biases compared to the WOA05 mean climatology from monthly means.

wpid-jclimate2011zheng-pdfpage47of64-2011-03-5-18-57.jpg

  • Warm biases are generally weaker in some models and some models have a cool bias to the south of the stratus deck region.
  • wpid-jclimate2011zheng-pdfpage48of64-2011-03-5-18-57.jpg
  • The warm bias increases in almost all models from the south to the north.
  • Total sfc heat flux bias for the different models are seen below. CCSM, MIROC-Medres and GISS seem to have the least positive bias. They have a negative bias all over the region. Rest of the models mostly have warm biases along the coast.

wpid-jclimate2011zheng-pdfpage49of64-2011-03-5-18-57.jpg

  • A positive heat flux bias can lead to sfc warming bias if it is not balanced by other ocean processes to cool the sfc.

wpid-jclimate2011zheng-pdfpage52of64-2011-03-5-18-57.jpg

Upper Ocean Processes

  • Horizontal heat advection

wpid-jclimate2011zheng-pdfpage16of64-2011-03-5-18-57.jpg

  • Most of the stratus deck region has a cold advection in SODA.
  • Most models have a positive (warm) biases of horizontal heat advection which largely contribute to the warm SST biases in these models.
  • Area averaged biases are shown in the figure below:

wpid-jclimate2011zheng-pdfpage54of64-2011-03-5-18-57.jpg

  • Zonal currents in most models are weaker than SODA while meridional currents are stronger than those in SODA.
  • Similarly the zonal gradient of temperature (-dT/dx) is underestimated and the meridional gradient of temperature is overestimated relative to SODA.
  • Thus the zonal heat advection have a larger uncertainty in most models and can be the primary cause of the warm bias in the SST.

Geostrophic heat advection

  • SODA shows cold advection in the open ocean and warm advection in the coastal region. Positive biases in the open ocean in most models support the causes for warm SST biases.

wpid-jclimate2011zheng-pdfpage58of64-2011-03-5-18-57.jpg

Ekman heat advection

  • SODA analysis shows warm Ekman advection in the open ocean and cold advection near the coast due to upwelled cold water.
  • Most models have a warm bias in Ekman heat advection in the open ocean.
  • Time mean cooling in the coastal region due to Ekman currents is much larger than the time-mean warming from geostrophic currents.

wpid-jclimate2011zheng-pdfpage59of64-2011-03-5-18-57.jpg
Vertical Heat Advection and Coastal upwelling

  • The vertical advection term is given by:

wpid-jclimate2011zheng-pdfpage21of64-2011-03-5-18-57.jpg

  • Coastal regions have strong upwelling and most models have a much weaker upwelling than SODA.
  • Larger vertical temperature gradients in the model compared to SODA compensates for the weaker vertical velocities and hence the vertical heat advection near the coast for most models has a lower bias.
  • The errors in vertical velocities in the open ocean, however, leads to a larger cold bias in the open ocean in most models.
  • The upwelling is stronger and over a narrower area in SODA than most other models. Also the model currents are weaker than SODA to transport the cold upwelled water offshore.
  • Overall, the magnitude of vertical heat advection is much smaller than horizontal heat advection in this region.
  • It is difficult to identify the reason for weaker upwelling in the CGCMs since there are many air-sea processes which contribute to this.

Discussion

  • Precise role of eddies in the heat budget of the SEP is still controversial. It was not within the scope of this study as none of the models compared were eddy resolving.
  • Two competing views about the role of eddies are:
    • Toniazzo, 2010 and Zheng, 2010 say that the long-term time mean eddy heat transport in this region is not important.
    • McWilliams and Colas (2010,2011) say that both horizontal advective heat transport and eddy driven heat transport are required in the region to maintain the SST.
  • McWilliams and Colas study mainly look at near shore processes and previous studies by Zheng et al., show that eddy driven heat transport is important near the coast but loses importance away from the coast.
  • Double diffusive processes within cold core eddies mix cold water up to the surface layer, thus cooling the surface according to recent studies by Farrar(2010), Moffat(2010), Straneo (2010), Zappa (2010).
  • Improving resolution in the OGCMs can improve the resolution of the narrow coastal upwelling and get rid of some of the warm bias.
  • Also, improving the winds in this region would do the same.
  • A reason for weaker winds in the CGCMs could be that:
    • The CGCMs have excessive rain even though deep convective systems are never observed in this region.
    • Excess rain would heat the atmosphere locally and hence lower the surface pressure. Thus the subtropical high pressure region is weakened, leading to weaker alongshore winds.
  • The excessive rainfall in the models could be due to the lack of sensitivity of the models to the mesoscale downdrafts cooling and drying the boundary layer.

Summary

  • All CGCMs have a warm bias in SST esp. north of 20 deg S.
  • Their surface fluxes have a negative bias though which actually damps the warm bias of the models.
  • Negative bias in latent and longwave radiation is seen in all models but the shortwave radiation has a positive bias due to lack of enough stratus deck cover.
  • Positive biases in the Ekman heat advection is the main cause for the warm bias. Error in geostrophic heat advection is also important but of a lower magnitude than the Ekman heat advection errors.

Zheng et al. Sea Surface Temperature Biases under the Stratus Cloud Deck in the Southeast Pacific Ocean in 19 IPCC AR4 Coupled General Circulation Models. Journal of Climate (2011)